Quality score, and how it’s calculated, has always been somewhat of a mystery to search marketers, but now, thanks to the help of Brad Geddes, PPC expert and author of Advanced Google AdWords, here’s a comprehensive view of how Quality Score is calculated and what you can do to improve your score.
In a webinar hosted by Acquisio, Brad Geddes outlines the three factors used to calculate Quality Score. After analyzing more than $100 million in ad spend, he details the weight of each factor, and describes how certain changes can affect your score and more importantly your conversion rate.
What is Quality Score?
Put simply, Quality Score is a 1 to 10 number that Google, or Bing, assigns to indicate how good an experience a user has with your ads and your landing pages. What’s most important for us marketers, is not necessarily what Quality Score is, but rather how that score influences your rank on a page and what you pay per click and conversion.
If what we care about is ad rank and what we pay, then understanding how ad rank is calculated is key.
How is Ad Rank Calculated?
Brad Geddes shares an estimated calculation for ad rank:
- 50% what you bid
- 40% your Quality Score
- 10% ad extensions
![]()
The first, and easiest thing to do to improve your rank is to add Google Ad Extensions or improve the ad extensions you already have in place.
A higher Quality Score means you won’t have to bid as much to rank in the top spots, so a good tactic to improve rank is to focus on improving Quality Score rather than increase your bid.
Improving your Quality Score, and learning how it’s calculated, is likely why you’re here reading this in the first place, so let’s get to it.
How is Quality Score Calculated?
Quality score is the number we can manipulate the most to lower our bids or raise our positions.
Google re-released an API that showed the factors, in detail, for every keyword. Using this information, looking across $100 million in ad spend, Brad Geddes was able to break Quality Score down into three factors, which each hold a different weight when calculating Quality Score.
The three factors are:
- Landing page experience
- Ad Relevance
- Expected CTR
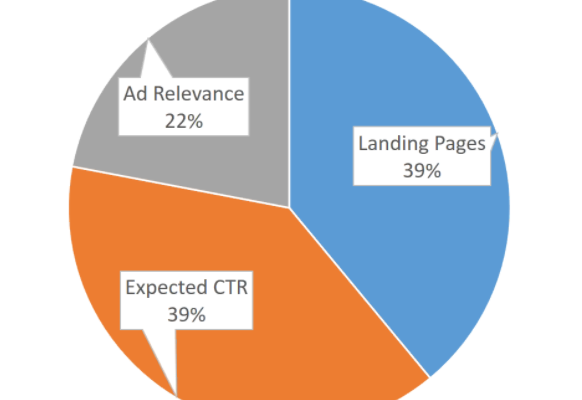
Weighted accordingly:
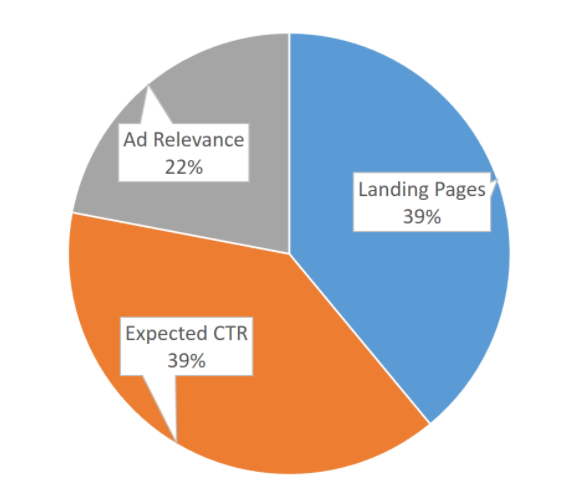
To understand what that weighting means, Brad Geddes put together a table showcasing how to calculate your Quality Score.
This table can help you understand how certain actions will affect your Quality Score.
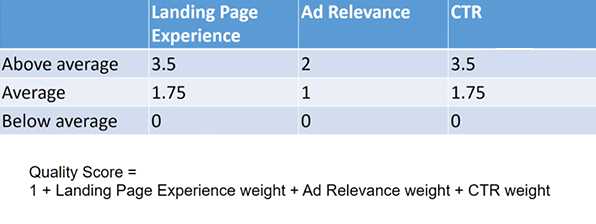
Using this table to calculate your own Quality Score means you give each factor a rank, between below and above average. If your landing pages are average, but your Ad Relevance and CTR are both above average, you would have a Quality Score of 1 + 1.75 + 2 + 3.5 = 8.25
So when it comes to improving Quality Score, for example, if your landing page experience is below average and you work to improve it so that it becomes above average, you’ll see a 3.5 bump in your Quality Score.
The tricky part is actually making the changes to improve your Quality Score, and to do that you need to understand each of the factors that go into Quality Score.
Understanding each Quality Score factor
Expected CTR
Unfortunately, there is no magic click through rate that is definitely good or bad. CTR will vary immensely between different keywords, branded and non branded terms, and more.
You may have a 40% CTR and can still be below average, explain Geddes.
To calculate expected click through rate, Google looks at a the keyword, at how commercial its intent is, what the historical CTR on this word is, position and more. But it’s not so straightforward.
Take the keyword television for example. The intent of the keyword is hard to determine, does a person want to buy a TV, review TVs, sell their TV, or what? For a vague keyword like this, a 1% CTR may be great.
For the keyword, “buy a Sony 40” plasma HD TV,” because that query is super specific and highly commercial, you could get 30% CTR and be average.
For brand term a 6% CTR is below average, they need a 15% just to be average and it takes 46% to be above average.
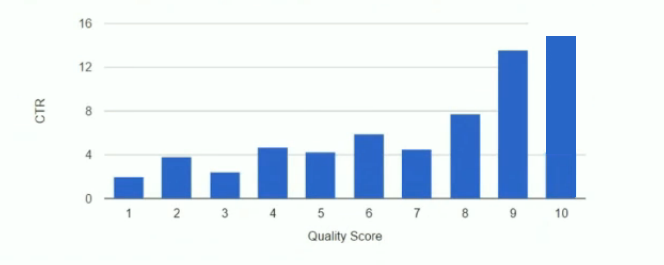
Geddes plotted the relationship between Quality Score and CTR for a particular client’s branded term, to show how high certain click through rates need to be in order to be above average, as you see in the image below. It’s important to note, this is one client’s results, and doesn’t represent all possible relationships.
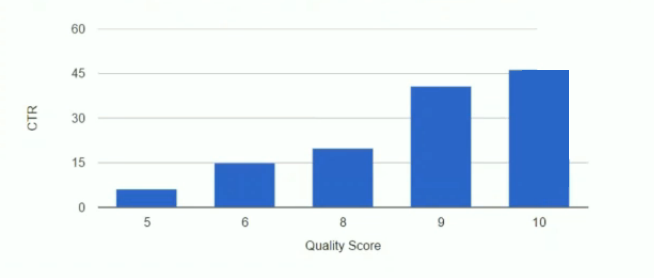
For branded terms, this client learned that:
- 6% CTR was below average (a quality score of 5)
- 15% CTR was average (quality score of 6)
- They needed at least 46% CTR to be above average (10 quality score)
For non-branded terms, they would need:
- 3.5% CTR to be below average
- 8.5% CTR to be average
- 14.5% CTR to be above average
This clearly demonstrates how different an above-average CTR can be for different branded and non-branded terms. You can’t say that a 20% CTR is good, because there is no set mark — it always depends on what Google expects from a CTR for that keyword.
If your CTR is average that means there’s someone doing better than you from a CTR standpoint, and it’s worthwhile to look at Ad Relevance to improve your CTR.
Ad Relevance
When you have below-average Ad Relevance it’s usually an indication of one of two things:
- You need better organization
- Your ads aren’t related to your keywords
- You need different ads
If you’re a mathematical person, and like scientific documents, you can read “Static Quality Scores and Ordering,” a public document from Stanford, or you can read more about “term frequency – inverse document frequency” or tf-idf and these documents will help you understand how ad relevance is calculated.
For us non-technical folk, who are not planning on reading these tech docs, Ad Releavnce relates to whether the query a user searches for contains top supporting keywords.
As Brad Geddes explains, imagine you’re playing the board game Taboo. You want your partner to guess your paid search term, so you say things like, new home, rate, 30 year, fixed, and so on. You can probably guess the paid search term was mortgage without even hearing it.
Inverse document frequency is all about having the supporting words alongside the keywords in your copy.
But using supporting keywords is a lot of work. Luckily, Bing published a lot of great ad data, for many different industries, and put them in heat maps, to show which combinations of words, per industry, have the best CTR.
In the grid below, a screenshot from Bing’s ad data for travel advertising, you can see that some combinations are green, meaning great, most are good, and several are bad.
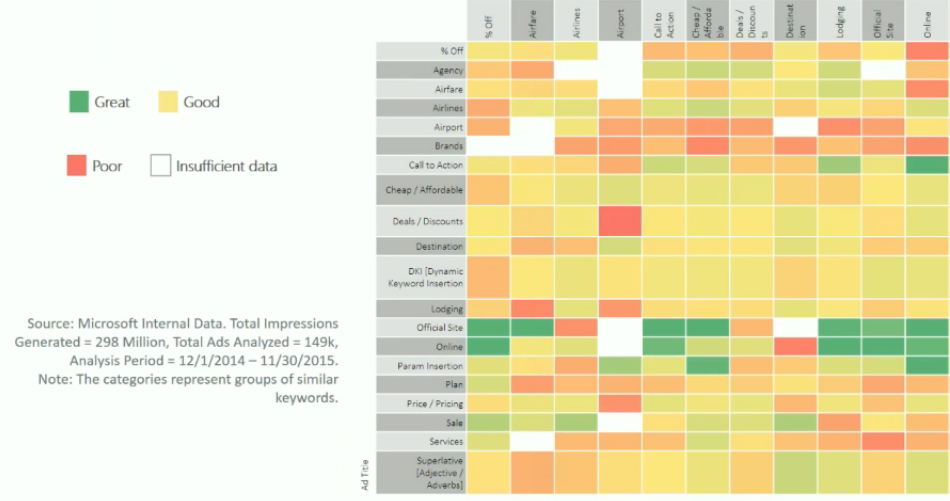
If you’re having trouble reading this, here’s how:
Ad descriptions are on the top axis, and the ad titles are on the side. What Bing looks at is the combination of titles and descriptions and how they affect CTR, because Ad Relevance and CTR are related.
If you have an ad that looks like “Search for flights online // Cheap flights to San Jose,” you’d have a bad CTR (red) because when you have “online” in your ad title and “destination” in the description line, these ads don’t do very well according to Bing.
If your ad read “Search online for your favorite hotel // 10% off popular destinations,” this one performs well (green) because when “online” is in the title and “% off” is in the description, users interact well with it. This ad will have a high relevancy because users like that combination.
If you’re having Ad Relevance problems, go look at the data Bing published for more than 175 industries, to learn what combinations of headlines and description lines users interact best with. It’s invaluable data that will help you to get the highest CTR possible.
But watch out! If you focus only on improving the CTR of your ads, you may be doing your business a disservice
Better CTR doesn’t always mean better conversions
If Google gives you a high Quality Score, that doesn’t necessarily mean your business is doing well, it just means your ads are getting clicked.
What’s common in B2B is that you don’t want all the clicks, just the good ones. Paid search for B2B clients doesn’t get conversions — it generates qualified users. You would need to convert that user on your website, or with nurturing and remarketing later on.
Your keywords and ads are meant to attract the right person to your site, not everybody. The more niche you are, the more you only want a small very particular subset of searchers to arrive at your page.
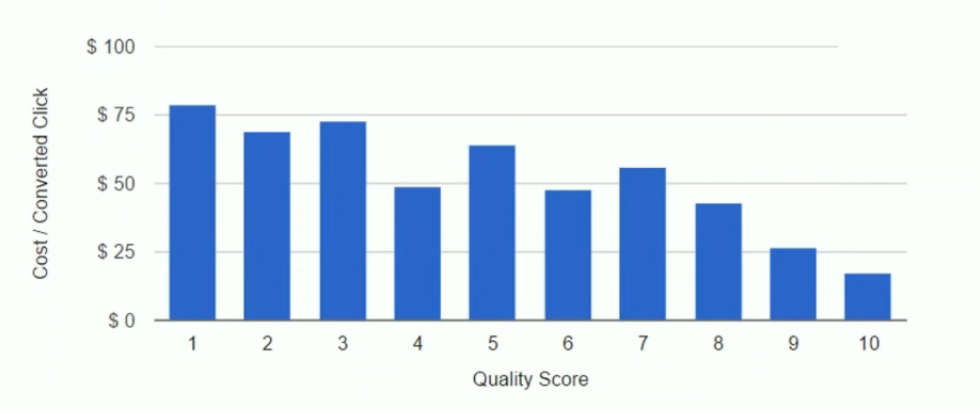
This is a chart for a B2B company looking at their conversion rates by Quality Score. As their Quality Score goes up, their conversion rate actually goes down.
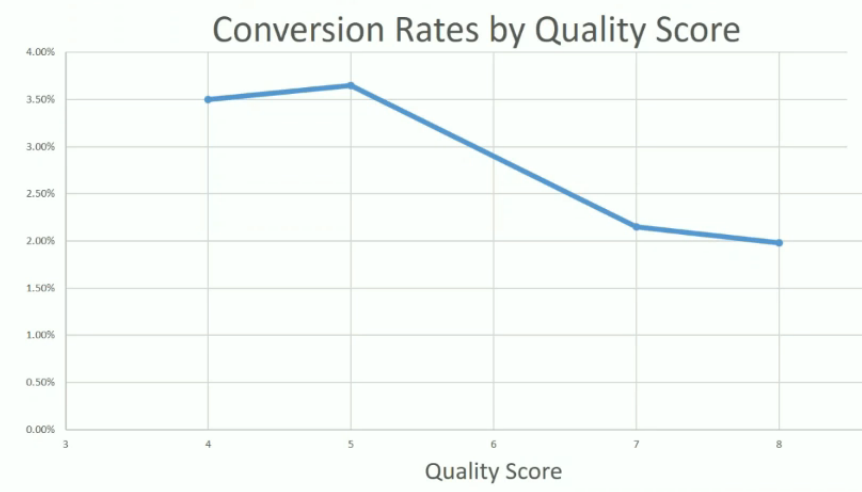
Why did this happen? It depends on the search term in question. In this case, the word is “safety gates.” The majority of people looking for safety gates want this item to keep their kids or pets out of the stairs, and they cost around $30.
However, there’s a subset of B2B advertisers bidding for this keyword, selling safety gates for a minimum of $1,000 for factories and industrial plants. These advertisers use strong pre-qualifying words, like “industrial,” “OSHA-compliant,” and “get quote,” because they only want to pay for clicks from industrial buyers.
Quality Score, Ad Relevance and CTR are all important, especially in B2C, but in B2B you’d probably do better with lower Quality Scores to attract the right users.
Typically as CTR goes up, Quality Score goes up and conversions go up, but that isn’t always the case, as we’ve just seen.
In another example, Geddes used a pivot table to graph Quality Scores in relation to CTR for a client in the travel industry, he noticed they had non-linear CTR rates (for example a Quality Score of 3 gets a better CTR than a Quality Score of 4). In that case the issue is the landing page, not the Ad Relevance.
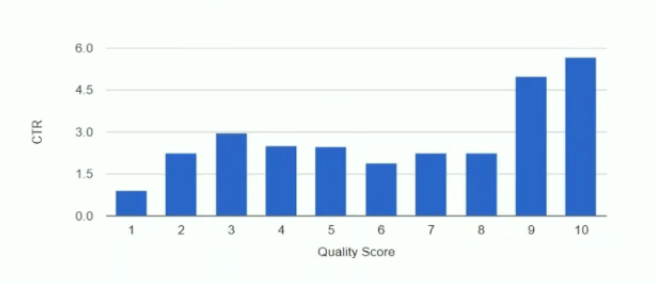
Landing Pages
In the above example, looking at the words with Quality Scores of 3 (where we see the peak in CTR), almost all the terms are airport codes to airport code (SJC-IAD) or city to city (Montreal to Toronto).
The problem this client had was that, if you take every airport code and every city, combined with every other airport code and every other city, you have hundreds of thousands of combinations. To handle this, their landing pages just prepopulate whatever terms someone is searching for, without making a page specific for each search.
Google looks at the page, and sees that your page isn’t actually related to a flight from San Jose to San Francisco, because none of the expected supporting words are used. Instead your page is about searching for flights, so you’d have a low Quality Score because of landing page relevance.
But if you’re anything like this client, you shouldn’t care. Taking the time to build out all those combinations of pages would cost millions in page design and endless hours, which wouldn’t be worth it.
Then the question is, why are these ads performing well from a click through rate standpoint? It’s because the ads are related to that specific search query, it’s only the landing pages that aren’t.
Landing pages have no effect on CPC
To discover what really affects CPC, Brad Geddes graphed the relation between CTR and CPC, low relevance and high relevance to CPC, and landing pages to CPC to see what had the most weight.
Turns out, landing pages appear to have no cost per click weight, which is weird since it’s one of the factors used to determine Quality Score.
That’s because your ads and campaigns have countless Quality Scores, not just one.
You have only one visible Quality Score, this is the number Google gives you, that we’ve been discussing at length. However, Google stores and calculates Quality Score at the intersection of a lot of different factors. They factor in every ad you have to every geographical location you serve to the time of day those ads are served. You could have an ad with thousands of Quality Scores, one for an ad served at 8am in Cleveland, another at 4pm in New York and thousands more.
Google and Bing give you a nice round number for a Quality Score to show you where to improve and to make it easy by not exposing all the information and variations calculated to get there. If they did you’d have more data than you’d ever want to analyze.
But if landing pages don’t appear to really affect CPC, and they’re a major component of Quality Score — making up 39% of the calculation — they have to be doing something else, right?
Landing pages affect impression share
When people consider improving ad rank, they want to be shown in higher positions and they want their ad to be shown more often. If you’re not showing up enough you’ll want to increase Quality Score. Why?
Because there’s a direct correlation between Quality Score and how often your ads are shown, aka impression share.
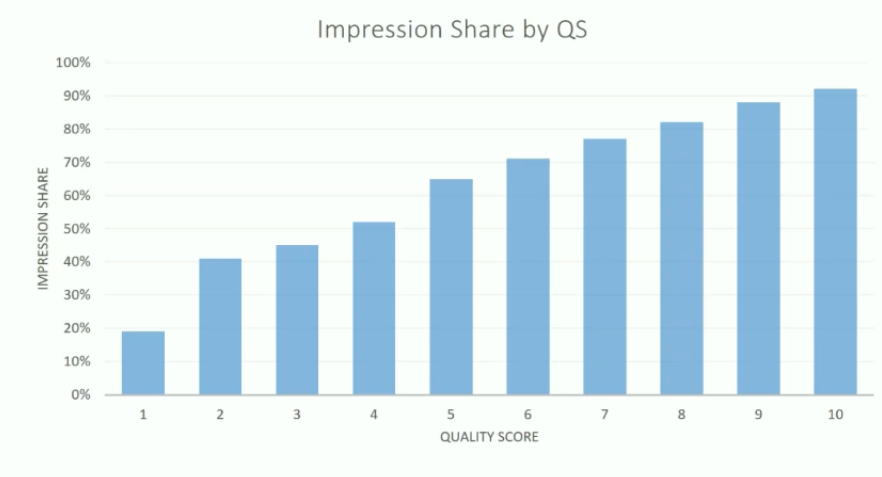
This relation helped Brad Geddes realize that landing pages actually affect impression share more than CPC.
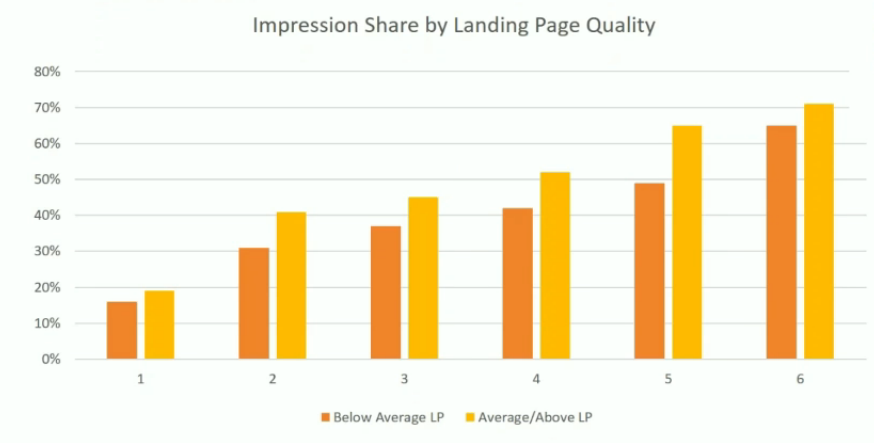
Brad looked at below and above-average landing pages in relation to Quality Scores between 1 and 6 (because you can’t have above-average landing pages with Quality Scores of less than 7 because landing page is worth 3.5 points).
He saw, very consistently, that below-average landing pages have lower impression shares than above average landing pages at the same Quality Score numbers.
Improving landing page experience may be a great way of increasing impression share, but if you’re looking to improve position, that takes a whole different approach.
How does Quality Score affect position and CTR?
You’ve likely seen an image of discounted CPCs for ads with Quality Scores over 7, similar to the one below. Brad Geddes revealed that the relationship between Quality Score and CPC isn’t so simple in all cases.
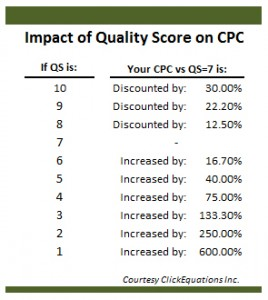
As your Quality Score goes up, your position goes up, which means you’re now bidding against a different person in the auction, and you’re paying a CPC to beat someone else. That means there’s no direct correlation between Quality Score going up and your CPCs going up or down.
There’s a stronger correlation between Quality Score increase and position and impression share increase.
If you’re in position 1 (1.0, meaning you’re always in 1) then you will see some CPC discounts as Quality Score increases. Here’s an example from one of Brad’s clients.
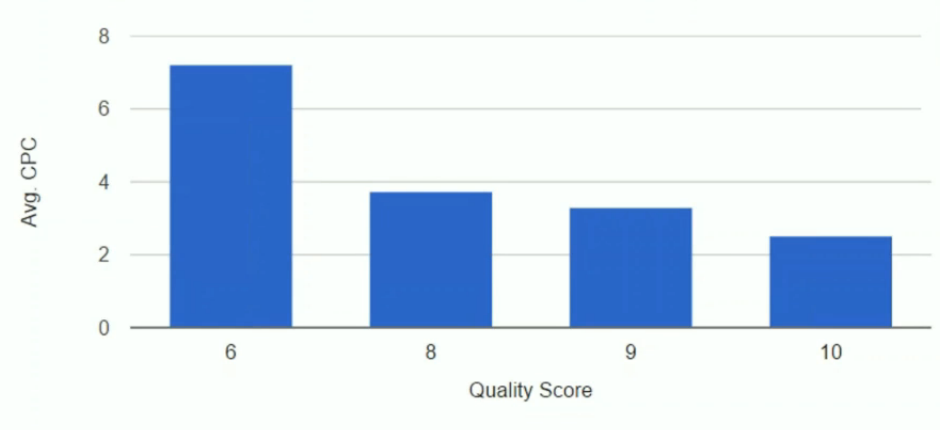
While the client saw CPC decrease as his Quality Score improved, the relation between better cost per conversion and Quality Score is more telling of the company’s success.
For some companies they see a flat chart, with no discount in the cost of conversions, and for this client, there is a significant discount.
But in position 5 and 6, or for other keywords or clients, for example, you’re not going to see CPCs and CPAs decline in the same way, but you will see ad rank improve instead.
What should I be looking at to improve Quality Score?
To understand which of the three main elements you need to work, Brad offers several suggestions to get you started.
Find Ad Groups that need help
Brad created a pivot table, as seen in the video below, on how to find the Ad Groups in your account that need the most help. This is a great place to start.
Once you find Ad Groups that have issues, this easy flow chart can help you figure out where to improve:
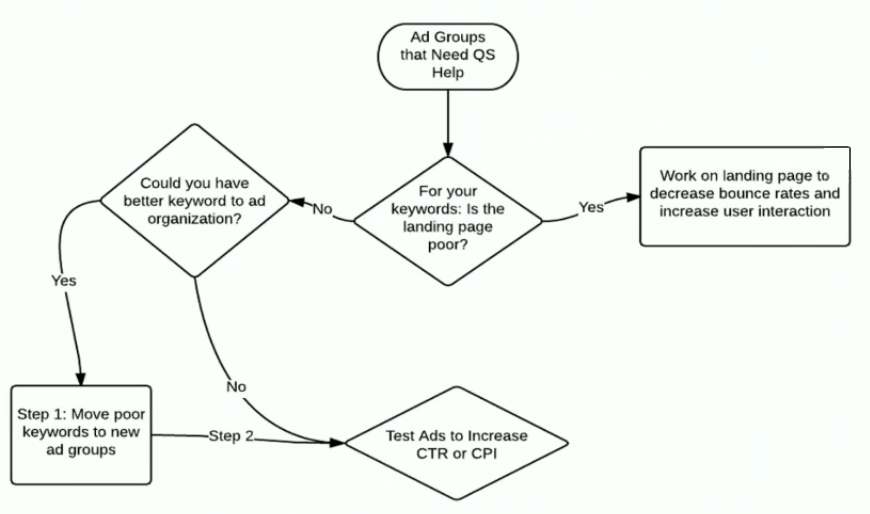
Find Ad Groups that need Quality Score help (using a pivot table above can help)
Ad Groups are collection of keywords and ads. If an Ad Group has problems, look at keywords and see if some have irrelevant ads, or if there are bad ad to keyword combinations.
For example, if you have a client running ads for every airport code and city name plus the word cheap flights (“cheap flights to {dynamic keyword insertion}”) with modified broad match, your ad for a flight to Seattle could actually appear for someone searching for a flight from Seattle, and that departure airport with an arrival airport makes a big difference, because the user doesn’t want an ad that suggests they fly to the city they live in when they wanted to fly from that city.
In this instance the problem is the organization and the client. Once they’ve discovered the issue, they can go about fixing it.
Calculate clicks and conversions per impression
If you want to understand which keywords to look at more closely and improve, you can compare clicks to impressions for different Quality Scores to see which ads are getting the most impressions and the lowest clicks proportionally (an area you’d want to fix, or at least understand).
This graph shows you gaps where you have a very high impression and a very low percentage of clicks for those impressions, and in this example you would want to narrow in on keywords with a Quality Score of 4, to see why they have so many impressions but so few clicks.
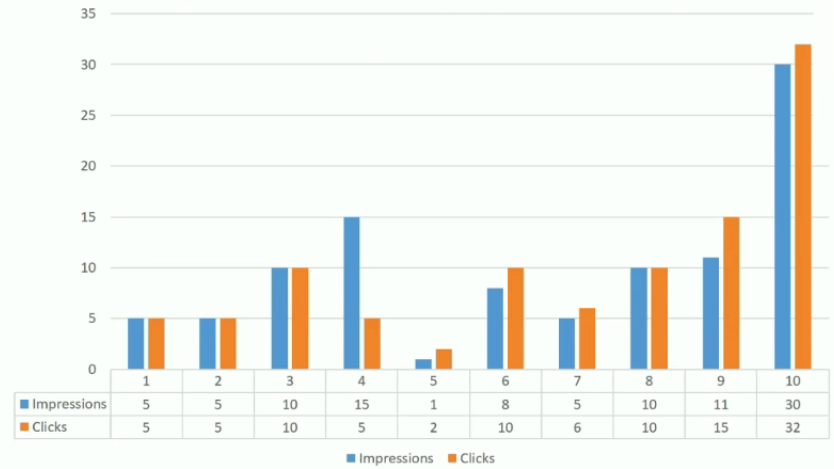
By isolating those keywords and analyzing them, you’ll be able to see where the click through rate problem is coming from and solve for it.
But what’s more important that clicks in terms of your business’s bottom line? Conversions!
Conversions per impression will tell you how often someone searched for your term (and you appeared) versus how many times they converted. This analysis accommodates both ctr and conversions and it great when working on Quality Score to make sure you’re getting as many conversions as possible and you aren’t doing all this work to improve landing pages, Ad Relevance and CTR for nothing.
TL;DR
Ad rank is calculated by combining your bid, Quality Score, and extensions.
- Quality score is made up of three different factors:
Expected CTR (which has a strong correlation between average CPCs). - Ad Relevance (which has a partial correlation between CPC, yet functions as a great indicator that your ads and keywords aren’t working well together).
- Landing pages (which have a weak correlation between CPC, but have a very strong correlation between rank and impression share).
To improve your Quality Score, remember that:
- CTR is relative. A 1% CTR could be great for a competitive keyword, and a 20% CTR could be below average for a highly commercial keyword. There is no definitively good CTR, it depends on your keyword and dozens of other factors.
- When it comes to ad relevance, having supporting keywords and using heat map data to learn which keyword combinations are most effective can improve relevance, which will help improve CTR.
- But watch out, CTR and a high Quality Score may not be the best representation of your company’s success. Conversions and sales are most important, and Quality Score is a proxy to these more telling metrics. Look into conversions per impressions to see where you need to improve.
- As much as possible, improve landing page relevance with keywords and supporting keywords, but remember landing pages don’t have any relation to CPC, they affect impression share.
Ultimately, increasing Quality Score is about better organization and lots and lots of ad testing.
To learn more about reverse engineering Quality Score from Brad Geddes, listen to the recorded webinar here.